
Solar Transition Platform for Australian Homeowners
Key results

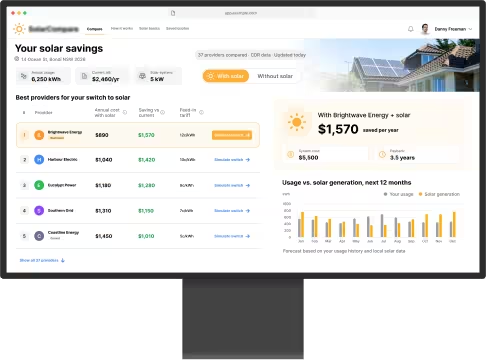
Dozens of energy providers compared in a single ranked list
Electricity and gas data via Australia's Consumer Data Right (CDR)
Security audit passed on the first attempt

2 Clojure developers

2 years
Country:
Australia
Industry:
EnergyTech
Platform:
Web
Service:
Staff Augmentation






About the Client


Our client runs a web platform that helps Australian homeowners decide whether switching to solar panels pays off. The platform calculates a household's annual electricity usage and the cost of transitioning to solar, using live data from local electricity providers.
Business Challenge
Australia's retail electricity market is fragmented. Many local providers have their own tariffs and APIs. For a homeowner, comparing what solar would actually cost, and which provider makes it most worthwhile, requires data no individual can realistically gather.
The platform had to:

pull data from many provider APIs and government sources |

keep that data current as tariffs change |
|
turn it into a personal answer for each household |
Solution

Integrated the APIs of local electricity providers and government energy data into a single comparison engine |

For each household, the platform ranks providers from most to least beneficial for a solar transition, based on calculated annual usage and costs |

A provider-switch simulation shows what the household's costs would look like under a different provider with or without solar |

A dedicated prognosis module in Python produces the usage and cost forecasts behind the rankings, with solar generation estimates from NREL's PVWatts |

Energy data comes from Australia's Consumer Data Right (CDR) framework. We initially consumed the government APIs directly, then migrated to Fiskil, an accredited CDR data platform — a newer, more convenient integration that also opened up gas consumption data alongside electricity |
Results

|
Homeowners get a single ranked list answering the question that used to require manual research across dozens of providers |
|
Cost simulation lets users evaluate a provider switch before committing |
|
The platform was to pass a security audit, so we ran a dedicated hardening round beforehand |
|
The provider ranking stays current as tariffs change, with forecasts recalculated by the prognosis module |
Technologies





Team Composition
Related Services

Staff Augmentation
Add vetted engineers to your in-house team and scale up or down as the project needs, with no long hiring cycle.


Clojure and ClojureScript development
Build reliable, data-heavy web products with a team that has shipped Clojure and ClojureScript in production for years.

Python Development
Use Python for forecasting, data processing, and backend services, like the prognosis module behind this platform's rankings.
More projects


